 15 Feb 2024
- Nine London boroughs lose value - with Kensington and Chelsea worst hit
- And, nine commuter areas lost an average of £35K off the value of properties
- Stark figures from the ONS reveal average UK house price dropped £4K in year
London workers have seen an average of £53,000 wiped off the value of their properties in the last 12 months.
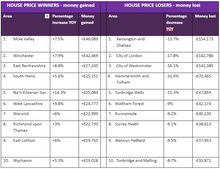
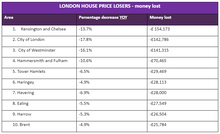
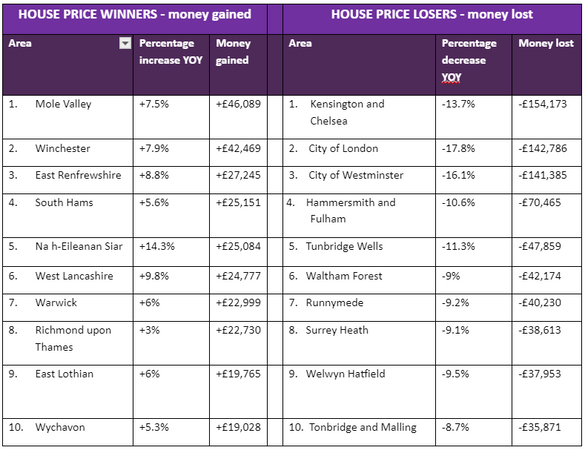
Nine London boroughs were hammered by price plunges, with Kensington and Chelsea being the hardest hit area, shedding an eye-watering £154,000 in 12 months, according to House Price Index (HPI) data and analysis by online estate agent Purplebricks.
Homeowners just outside the capital have little to celebrate too, with homes in nine commuter belt areas losing an average of £35,000 in the space of a year.
In total, 18 of the top 20 worst-hit areas were either in the capital itself or a borough or district surrounding it - the average loss among them being £53,000.
The stark figures from the Office for National Statistics reveal average UK house prices fell by £4,000 or 1.4% in the 12 months to December, making a typical house worth £285,000.
The fall in prices is a slight improvement on the drop of 2.3% for the 12 months up to November.
Average property prices in both England and Wales fell, with a typical house in England falling 2.1% in value to £302,000, and dropping 2.5% to £214,000 in Wales.
The North East of England saw the biggest price change with an increase of 1.2%, while overall London was hit the hardest with a 4.8% slump.
However, homes in Scotland are now worth an average of £190,000 after enjoying a 3.3% rise in the last year.
And, average properties rose 1.4% to £178,000 in Northern Ireland in the year to Quarter 4, from October to December 20223.
In the capital, the City of London and Westminster lost around £142,000 and £141,000 respectively, while Hammersmith and Fulham properties dropped £70,000, Waltham Forest homes lost £42,000 and Haringey shed £28,000.
Outside London, the leafy stockbroker belt town of Tunbridge Wells took a bruising, with the average home losing around £47,000.
Homes in popular commuter areas like Runnymeade, Surrey Heath, Welwyn Hatfield, Tonbridge and Malling and St Albans lost an average of £37,000 in the last 12 months.
But it wasn't all bad news for people living in and around the capital, with properties in the London borough of Richmond upon Thames increasing £22,730 in value, and homeowners in the Surrey district of Mole Valley seeing a rise of £46,089.
Sam Mitchell, CEO of Purplebricks said: 'While these figures may appear quite striking, there is plenty of good news for homeowners, and plenty more on the horizon.
'Homeowners in Scotland and Northern Ireland are continuing to see increases, and evidently the rate of decline is slowing across the UK in general.
'As long as we continue to see inflation moving in the right direction so the mortgage markets continue to move, I predict this trend will continue, and by the end of the year average UK prices will be back on the increase – and that, of course, includes the capital.'
|
HOUSE PRICE WINNERS - money gained |
HOUSE PRICE LOSERS - money lost |
|||||
|
Area |
Percentage increase YOY |
Money gained |
Area |
Percentage decrease YOY |
Money lost |
|
|
+7.5% |
+£46,089 |
|
-13.7% |
-£154,173 |
|
|
+7.9% |
+£42,469 |
2. City of London |
-17.8% |
-£142,786 |
|
|
+8.8% |
+£27,245 |
3. City of Westminster |
-16.1% |
-£141,385 |
|
|
+5.6% |
+£25,151 |
4. Hammersmith and Fulham |
-10.6% |
-£70,465 |
|
|
+14.3% |
+£25,084 |
5. Tunbridge Wells |
-11.3% |
-£47,859 |
|
|
+9.8% |
+£24,777 |
6. Waltham Forest |
-9% |
-£42,174 |
|
|
+6% |
+£22,999 |
7. Runnymede |
-9.2% |
-£40,230 |
|
|
+3% |
+£22,730 |
8. Surrey Heath |
-9.1% |
-£38,613 |
|
|
+6% |
+£19,765 |
9. Welwyn Hatfield |
-9.5% |
-£37,953 |
|
|
+5.3% |
+£19,028 |
10. Tonbridge and Malling |
-8.7% |
-£35,871 |
|
|
LONDON HOUSE PRICE LOSERS - money lost |
||
|
Area |
Percentage decrease YOY |
Money lost |
|
-13.7% |
-£ 154,173 |
|
2. City of London |
-17.8% |
-£142,786 |
|
3. City of Westminster |
-16.1% |
-£141,315 |
|
4. Hammersmith and Fulham |
-10.6% |
-£70,465 |
|
5. Tower Hamlets |
-6.5% |
-£29,469 |
|
6. Haringey |
-4.9% |
-£28,113 |
|
7. Havering |
-6.9% |
-£28,000 |
|
8. Ealing |
-5.5% |
-£27,549 |
|
9. Harrow |
-5.3% |
-£26,504 |
|
10. Brent |
-4.9% |
-£25,784 |
– ENDS –
Notes to editors
ONS UK House Price Index data for December 2023, released on 14 February 2024
About Purplebricks
Founded in 2012, Purplebricks is the UK's most popular estate agency. By leveraging technology and the expertise of its people, Purplebricks makes the process of buying and selling homes cheaper, less stressful and more transparent. The business was acquired by Strike, an estate agency group backed by Freston Ventures, in 2023, and continues to disrupt the property industry by allowing customers to sell their homes for free.