 16 Jan 2026

The UK property market lies at a critical juncture, according to Home.co.uk's House Price Index for January.
With overall growth trending to zero and possibly below, confidence is on the ebb even for the most seasoned property bulls. Losses in capital values in real terms and falling rents are operating like a pincer movement on property investors.
“Hold on and hope” stalwarts are gradually capitulating. For any prospective buyers, caveat emptor must be taken seriously as valuations slide.
With stock levels at their highest for many years and persistent oversupply, the situation is not going to improve anytime soon.
Despite December's cut, mortgage rates remain too high for demand to take up the slack, found Home.co.uk.
It adds that “prices are soft and sliding because many investors are willing to take a hit if it allows them to cash out quickly and turn to other more profitable markets. The sense of urgency is palpable”.
Headlines
- Vendor numbers rebounded during December in the wake of November's hesitancy. Twenty per cent more properties were placed on the market than in December 2024. The largest surges in new sales listings were in Scotland, the North East, East Midlands and the North West.
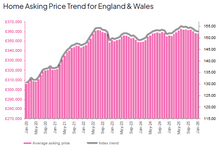
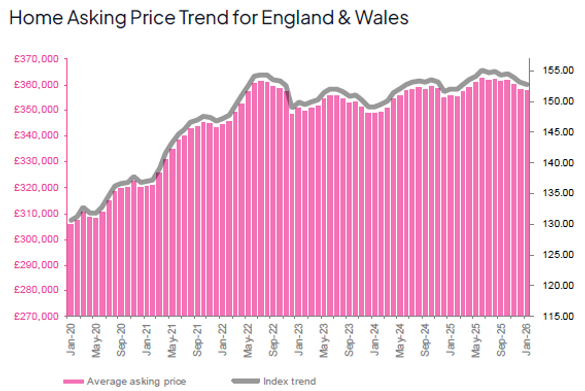
- Pricing remains very subdued. Agents are clearly pricing to sell in an increasingly challenging market. Home prices in England and Wales are just 0.5% higher than in January 2025.
- The mix-adjusted average slipped in Wales, Scotland and all English regions except the North East (+0.7%), North West (+0.3%) and Greater London (+0.4%). The East of England indicated the largest month-on-month decline (-0.8%).
- While the total unsold stock on the market has decreased over recent months, the current total is the highest January figure since 2015. Moreover, seasonal expectations indicate a rapid rise over the next six months.
- The North East is now the top regional property market growth leader with a year-on-year gain of 2.7%, pushing the North West into second place. Meanwhile, London remains the worst regional performer with an annualised decline extending to 1.0%.
- Typical Time on Market (TTM) for unsold properties continues to move higher overall and is currently five days higher than in January last year. The worst increase in marketing times is to be found in the South West and prices are correcting accordingly.
- The annualised national growth in asking rents trends even further into the negative (now -4.1%) thus providing further downward pressure on home prices. All English regions, Scotland and Wales continue to indicate year-on-year declines in the mix-adjusted average asking rent. The worst performer is the East Midlands with an annualised decline of 12.5%.
- Eighteen of the 33 London boroughs indicate negative asking rent growth. Kensington and Chelsea is the slowest market (TTM: 49 days) and asking rents have fallen 6.9% over the last twelve months in this borough.
For media enquiries please contact: press@home.co.uk, 0845 373 3580
For more information visit here.
Follow us on X