 20 Jan 2026
- Continued improvement in affordability helped support first-time buyer activity over 2025
- Considerable variation in affordability remains across occupational groups, with affordability most challenging for people working in sales & customer service, but easier for those in managerial and professional roles
- Affordability most stretched in London and South of England, while North and Scotland are the most affordable
- 10% deposit on typical UK first-time buyer property around £23k – this would take nearly six years to save
Commenting on the figures, Andrew Harvey, Nationwide's Senior Economist, said:
“With price growth well below the rate of earnings growth and a steady decline in mortgage rates, affordability constraints have eased somewhat over the past year, helping to underpin buyer demand.
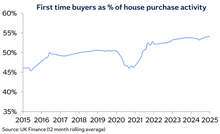
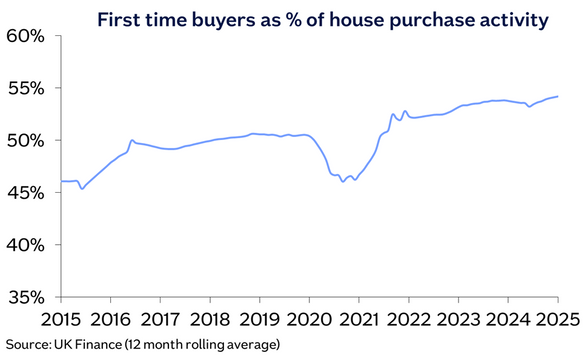
“Indeed, the first-time buyer share of house purchase activity was above the long run average, supported by easier credit availability, with the share of high loan-to-value lending (i.e. with a deposit of 15% or less) reaching its highest level for over a decade. First-time buyer activity over the last year was around 20% higher than 2024 levels.
“Our main affordability benchmark shows that a prospective buyer earning the average UK income and buying a typical first-time buyer property with a 20% deposit would have a monthly mortgage payment equivalent to 32% of their take-home pay – slightly above the long-run average of 30% and well below the recent high of 48% recorded in 1989.
“There has also been an improvement in the first-time buyer (FTB) house price to earnings ratio (HPER) to 4.7. This is a continuation of the trend seen over recent years, with the ratio now slightly below its 20-year average. Consequently, this suggests it is a little easier for prospective buyers to save for a deposit, although it is still particularly challenging for those in the private rented sector, given rental increases in recent years.
“Indeed, a 10% deposit on a typical UK first-time buyer property is around £23,000. Even based on saving 10% of average net pay (c. £320) per month it would take a prospective buyer nearly six years to accumulate this. However, the level of deposit required also varies considerably by region, reflecting differences in average house prices. For example, a 10% deposit in London is over three times larger than the equivalent in the North (as illustrated below). It would also take a Londoner nine years to save for their deposit versus around four years for someone buying in the North, based on saving 10% of their average net pay.
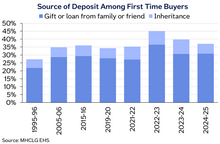
“Consequently, a significant proportion of first-time buyers still have to draw on help from friends and family to raise a deposit. In 2024/25, over a third of first-time buyers had some assistance raising a deposit, either in the form of a gift or loan from family or friends, or through an inheritance.
“Looking ahead, we expect housing market activity to strengthen a little further as affordability continues to improve gradually via income growth outpacing house price growth and a further modest decline in interest rates.
Considerable variation in affordability across different occupational groups
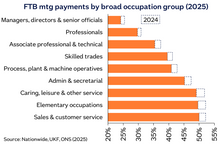
“We've also explored how affordability varies for people in different professions. Perhaps unsurprisingly, mortgage payments relative to take-home pay remain lowest for those in managerial and professional roles, where average earnings tend to be higher (see chart attached).
“All occupations have seen an improvement in affordability since 2024, with the biggest improvement being for those working in caring, leisure and other service occupations, which have seen higher earnings growth.
“Note that these are benchmark measures, which use the average earnings in each occupational group and the UK typical first-time buyer property price. In practice, those in higher paid occupations are more likely to purchase more expensive properties.
“Affordability is most challenging for those working in sales and customer service roles and for those classified as 'elementary occupations', which include construction and manufacturing labourers, cleaners and couriers. In these groups, typical mortgage payments would represent around 50% of average take-home pay.
“The differences in affordability reflect the divergence in earnings by occupational group. For example, managers, directors and senior officials typically take home around twice as much per year than those working in administrative and secretarial roles.
How does the affordability picture vary across regions?
“All parts of the UK, with the exception of Northern Ireland, have seen a continued improvement in affordability over the past year when looking at the costs of servicing the typical mortgage as a share of take-home pay.
“Northern Ireland saw a deterioration in affordability due to the strong house price growth experienced over the past year. And, while mortgage payments as a share of take-home pay are a little lower than the UK average, they are now noticeably above the long-run average in the region.
“For the second year running, London saw the largest improvement in affordability, reflecting relatively weak house price growth in 2025, solid earnings growth and lower interest rates. Nevertheless, the capital remains the least affordable region by a significant margin (see chart above). Affordability pressures remain pronounced in the South of England, whilst in the North, Yorkshire & The Humber and Scotland, mortgage payments as a share of take-home pay are actually slightly below their long-run average.
“Most regions have seen a slight improvement in their house price to earnings ratios relative to a year ago, with London continuing to have the highest house price to earnings ratio at 7.5 and Scotland the lowest at 2.9.
“These regional variations in affordability have led to some stark differences emerging between those who would like to buy and those that can do so. To explore this further, we looked at how the mean earnings for actual first-time buyers compared to the regional average incomes used in our affordability benchmarks.
“London stands out as the area with the greatest divergence, with actual first-time buyer earnings (for a single borrower) around 45% higher than average incomes in the capital. But in regions where affordability is less stretched, such as the Midlands, actual first-time buyer earnings tend to be much closer to regional averages. And in a few areas, most notably Scotland, the incomes of actual first-time buyers are below the average income in the region, indicating relatively healthy housing affordability.”
-ends-
Notes to Editor
- Images and PDF version of report attached.
Indices and average prices are produced using Nationwide's updated mix adjusted House Price Methodology, which was introduced with effect from the first quarter of 1995. The data is drawn from Nationwide's house purchase mortgage lending at the post survey approvals stage. Price indices are seasonally adjusted using the US Bureau of the Census X12 method. Currently the calculations are based on a monthly data series starting from January 1991. Figures are recalculated each month which may result in revisions to historical data.
More information on the house price index methodology along with time series data and archives of housing research can be found at https://www.nationwide.co.uk/media/hpi/.
Media enquiries / requests for interview with Nationwide's Senior Economist, Andrew Harvey:
Mike Pitcher, 07587 888295, mike.pitcher@nationwide.co.uk